Analytics
You can monitor API usage with key insights.
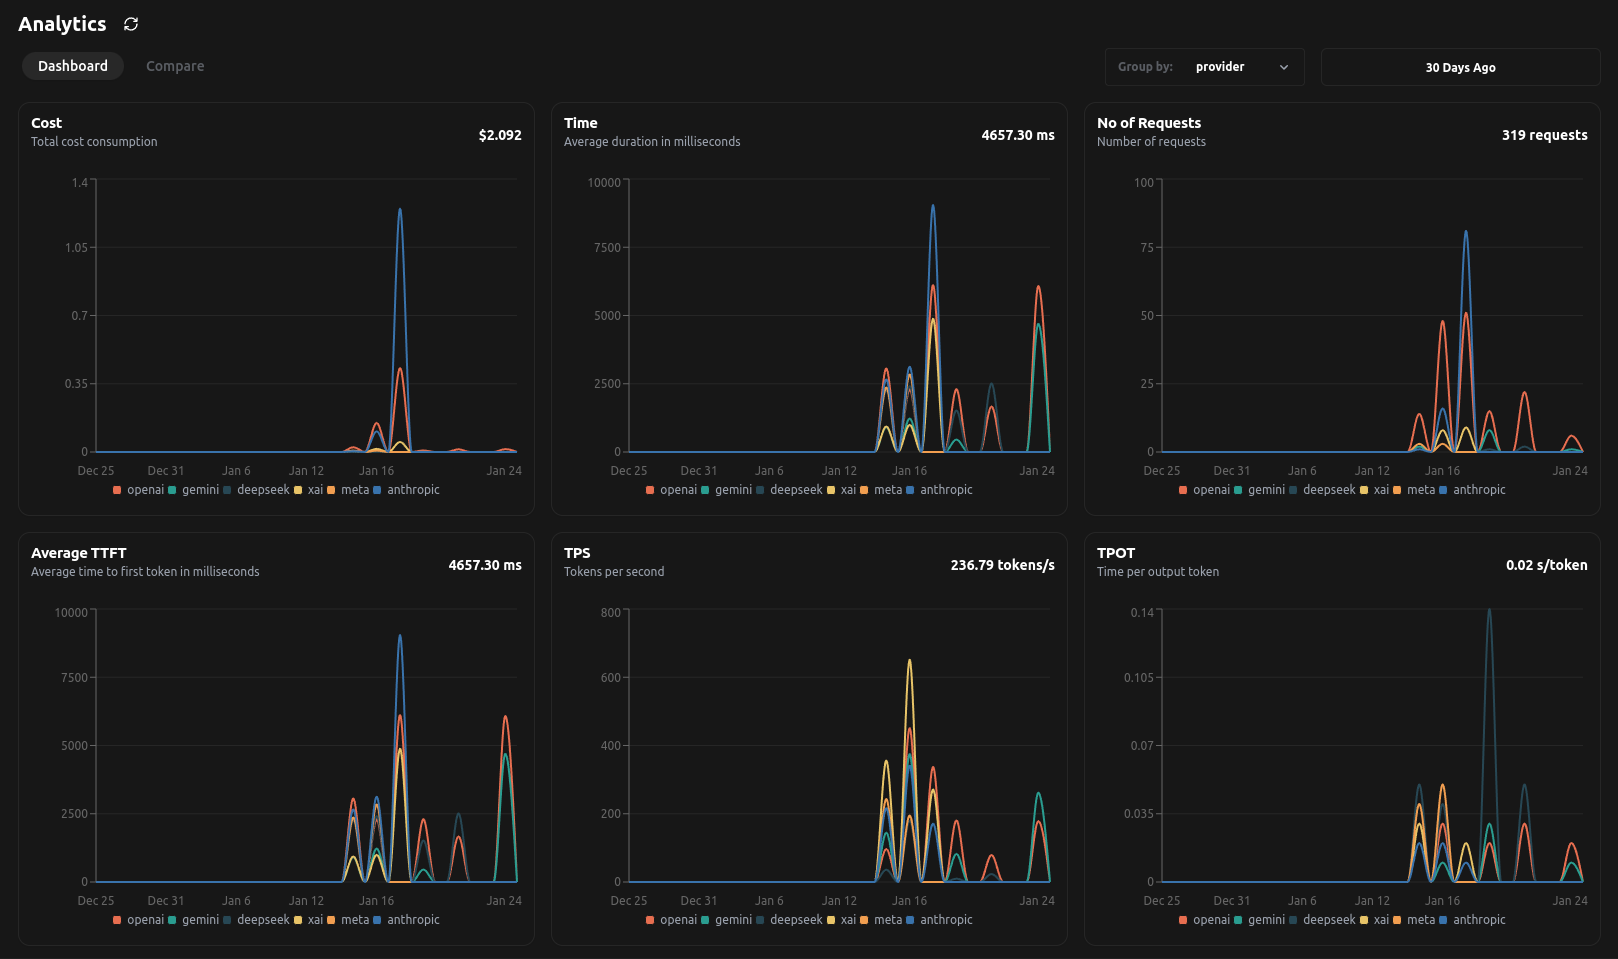
After integrating LangDB into your project, the Analytics Dashboard becomes your central hub for understanding usage.
Metrics
LangDB’s Analytics Dashboard is segmented into several key panels:
Cost:
- Tracks your total cost consumption across all integrated models.
- Enables you to compare costs by provider/model/tags, helping you identify the most cost-effective options for your use cases.
Time:
- Displays the average duration of requests in milliseconds.
- Useful for benchmarking response times and optimizing performance for latency-sensitive applications.
Number of Requests:
- Shows the total number of API calls made.
- Helps you analyze usage patterns and allocate resources effectively.
Average Time to First Token (TTFT)
- Indicates the average time taken to receive the first token from the API response.
- This metric is critical for understanding initial latency.
Tokens Per Second (TPS)
- Measures the throughput of token generation.
- High TPS is indicative of efficient processing.
Time Per Output Token (TPOT)
- Tracks the average time spent per output token.
- Helps in identifying and troubleshooting bottlenecks in model output.
Error Rate
- Displays the percentage of failed requests over total requests.
- Helps monitor system stability and reliability.
Error Request Count
- Tracks the total number of failed API requests.
- Useful for debugging and troubleshooting failures effectively.
Analytics APIs
Fetch analytics data
Provides a detailed timeseries view of API usage metrics. Users can filter data by time range and group it by provider, model, or tags to analyze trends over different periods.
# grouby: provider/tag/model
curl --location 'https://api.langdb.ai/analytics' \
--header 'x-project-id: langDBProjectID' \
--header 'Content-Type: application/json' \
--header 'Authorization: Bearer langDBAPIKey' \
--data '{"start_time_us": , "end_time_us": , "groupBy": ["provider"]}'
Example response:
{
    "timeseries": [
    {
            "hour": "2025-01-23 04:00:00",
            "total_cost": 0.0006719999999999999,
            "total_requests": 2,
            "avg_duration": 814.4,
            "duration": 814.4,
            "duration_p99": 1125.4,
            "duration_p95": 1100.0,
            "duration_p90": 1068.3,
            "duration_p50": 814.4,
            "total_duration": 1628.778,
            "total_input_tokens": 72,
            "total_output_tokens": 38,
            "error_rate": 0.0,
            "error_request_count": 0,
            "avg_ttft": 814.4,
            "ttft": 814.4,
            "ttft_p99": 1125.4,
            "ttft_p95": 1100.0,
            "ttft_p90": 1068.3,
            "ttft_p50": 814.4,
            "tps": 67.54,
            "tps_p99": 110.03,
            "tps_p95": 107.55,
            "tps_p90": 104.45,
            "tps_p50": 79.63,
            "tpot": 0.04,
            "tpot_p99": 0.06,
            "tpot_p95": 0.06,
            "tpot_p90": 0.06,
            "tpot_p50": 0.04,
            "tag_tuple": [
                "openai"
            ]
        }
    ]
}
Fetch analytics summary
Provides aggregated usage metrics, allowing users to get a high-level overview of API consumption and error rates.
# groupby: provider/tag/model
curl --location 'https://api.langdb.ai/analytics/summary' \
--header 'x-project-id: langDBProjectID' \
--header 'Content-Type: application/json' \
--header 'Authorization: Bearer langDBAPIKey' \
--data '{"start_time_us": , "end_time_us": , "groupBy": ["provider"]} '
Example response:
{
    "summary": {
            "tag_tuple": [
                "togetherai"
            ],
            "total_cost": 0.0015163199999999998,
            "total_requests": 8,
            "total_duration": 5242.402,
            "avg_duration": 655.3,
            "duration": 655.3,
            "duration_p99": 969.2,
            "duration_p95": 962.5,
            "duration_p90": 954.1,
            "duration_p50": 624.3,
            "total_input_tokens": 853,
            "total_output_tokens": 200,
            "avg_ttft": 655.3,
            "ttft": 655.3,
            "ttft_p99": 969.2,
            "ttft_p95": 962.5,
            "ttft_p90": 954.1,
            "ttft_p50": 624.3,
            "tps": 200.86,
            "tps_p99": 336.04,
            "tps_p95": 304.95,
            "tps_p90": 266.08,
            "tps_p50": 186.24,
            "tpot": 0.03,
            "tpot_p99": 0.04,
            "tpot_p95": 0.04,
            "tpot_p90": 0.04,
            "tpot_p50": 0.03,
            "error_rate": 0.0,
            "error_request_count": 0
        },
}
Filtering By Users
As discussed in User Tracking, we can use filters to retrieve insights based on id, name, or tags.
Available Filters:
user_id: Filter data for a specific user by their unique ID.user_name: Retrieve usage based on the user’s name.user_tags: Filter by tags associated with a user (e.g., "websearch", "support").
curl -L \
  --request POST \
  --url 'https://api.langdb.ai/analytics/summary' \
  --header 'Authorization: Bearer langDBAPIKey' \
  --header 'X-Project-Id: langDBProjectID' \
  --header 'Content-Type: application/json' \
  --data '{
    "user_id": "123",
    "user_name": "mrunmay",
    "user_tags": ["websearch", "testings"]
  }'
Example response:
{
  "summary": [
    {
      "total_cost": 0.00112698,
      "total_requests": 4,
      "total_duration": 31645.018,
      "avg_duration": 7911.3,
      "duration": 7911.3,
      "duration_p99": 9819.3,
      "duration_p95": 9809.0,
      "duration_p90": 9796.1,
      "duration_p50": 8193.2,
      "total_input_tokens": 4429,
      "total_output_tokens": 458,
      "avg_ttft": 7911.3,
      "ttft": 7911.3,
      "ttft_p99": 9819.3,
      "ttft_p95": 9809.0,
      "ttft_p90": 9796.1,
      "ttft_p50": 8193.2,
      "tps": 154.43,
      "tps_p99": 207.79,
      "tps_p95": 206.1,
      "tps_p90": 203.99,
      "tps_p50": 160.85,
      "tpot": 0.07,
      "tpot_p99": 0.1,
      "tpot_p95": 0.09,
      "tpot_p90": 0.09,
      "tpot_p50": 0.07,
      "error_rate": 0.0,
      "error_request_count": 0
    }
  ],
  "start_time_us": 1737576094363076,
  "end_time_us": 1740168094363076
}